Namely Analytics: Diversity Dashboard
Diversity Dashboard
The Diversity dashboard provides a point-in-time snapshot of your organization's gender, ethnicity, and age diversity. The dashboard allows you to examine diversity across office locations, departments, roles, and more. By using Namely Analytics' filtering system, you can drill down on your data even further to gain new insights into your employee population.
For more information on using Namely Analytics dashboard, including how to select filters and download reports, see Namely Analytics
The Diversity dashboard is composed of five sections:
Overview
The Overview section displays gender, ethnicity, and age diversity at a company-wide level.
-
Note: All data is pulled from employees' Namely profiles.
Office Location and Department
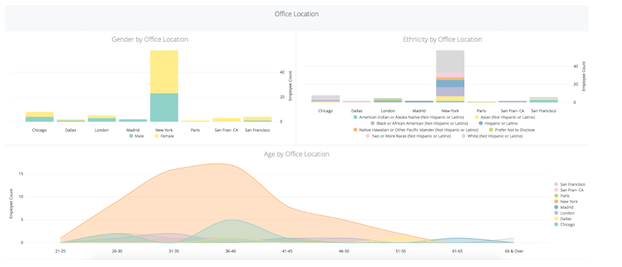
Use the Office Location and Department sections to compare diversity metrics across locations and departments without the use of filters.
-
If you have a high number of office locations or departments, you can download your data for easier viewing.

Managers
Managers are defined as any employee who has a direct report in Namely.
Expanding on Diversity
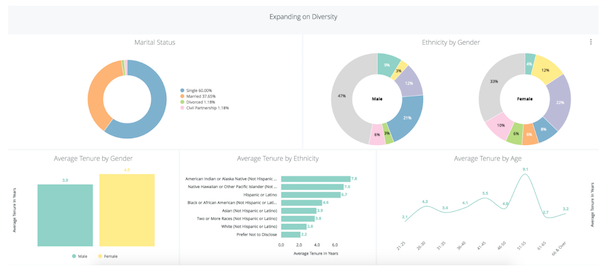
The Expanding on Diversity section provides additional metrics by which to view your company's diversity, including marital status and tenure.

Getting the Most Out of the Diversity Dashboard
Age Increment Filter
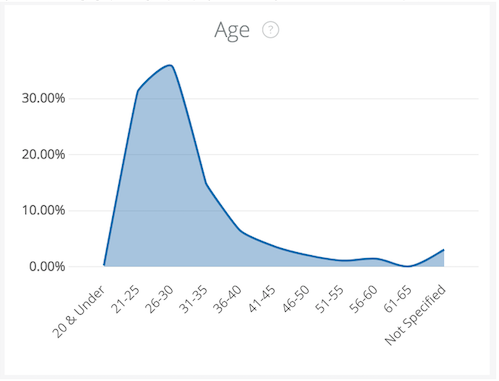
By default, the Age graph will group employees into five-year increments, for example, 21-25, 26-30, etc.

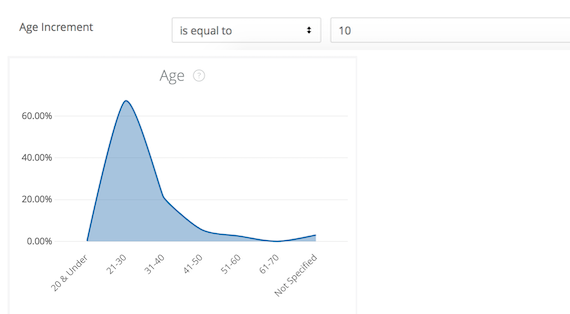
You can change these year groupings by adjusting the Age Increment filter.

View Diversity in Leadership
Use the Job Title filter to view diversity of employees in leadership positions. Choose job titles that correspond to leadership roles at your organization.